By the numbers
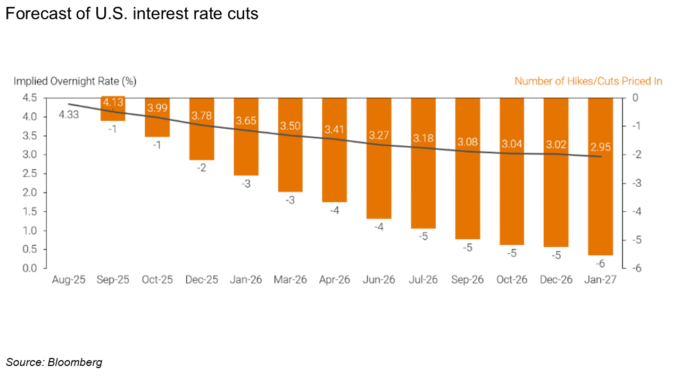
Rate cuts on the horizon, long-term borrowing stays firm
As the saga over the independence of the Federal Reserve continues to escalate, now heading to the courts, Chair Powell signaled that a rate cut was possible at the September meeting despite frothy economic signals. Bloomberg’s implied overnight rate falls to roughly 3% by the end of 2026, but the 10-year Treasury yield remained high, ending August 26 at 4.26%. While many dynamics motivate investing trends in clean energy, few are as powerful as the impact of falling rates.
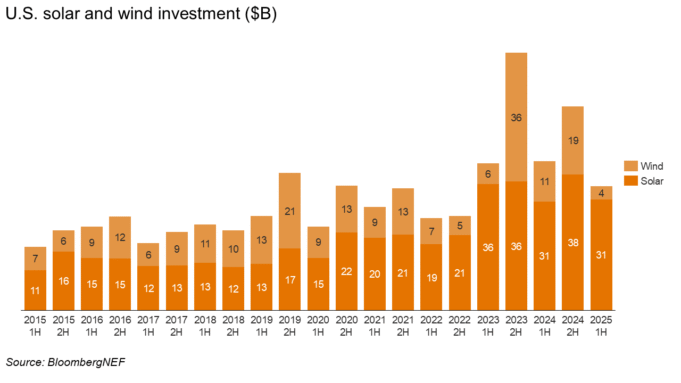
U.S. solar investment is steady compared to 1H 2024, despite headlines
BloombergNEF’s latest Renewable Energy Investment Tracker generated a lot of headlines such as “Why investors are avoiding U.S. renewables,” but a closer look at the data shows this is not really the case. Most stories focused on the 36% drop from 2H 2024 to 1H 2024, but this mirrors the decline from 2H 2023 to 1H 2024 rather than being an exception: renewable investment fell 43% from 2H 2023 to 1H 2024. Wind is clearly suffering, but U.S. solar investment remained in line with 1H last year at $31 billion. There was also plenty to celebrate elsewhere, with renewable energy investment across the EU-27 rising 63% to an all-time high of $76 billion.
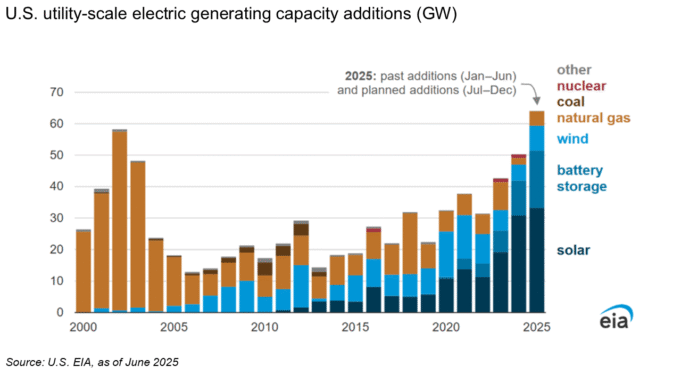
Real headwinds, real build
The headwinds facing the industry are material, but we should be equally clear about the near-term opportunity. Despite daily headlines about project cancellations, there will be more U.S. solar and battery capacity installed over the next three years than at any point in the industry’s history. There are more good projects that can still receive subsidies than there is capital to fund them. The EIA estimates that developers added 12 GW of U.S. utility-scale solar power capacity in H1 2025, with the end-of-year total expected to be 33 GW alongside 26 GW of battery and wind capacity (link). Throw in some 11 GW of residential and commercial solar, as forecast by BloombergNEF, and 2025 will have record clean power installations.
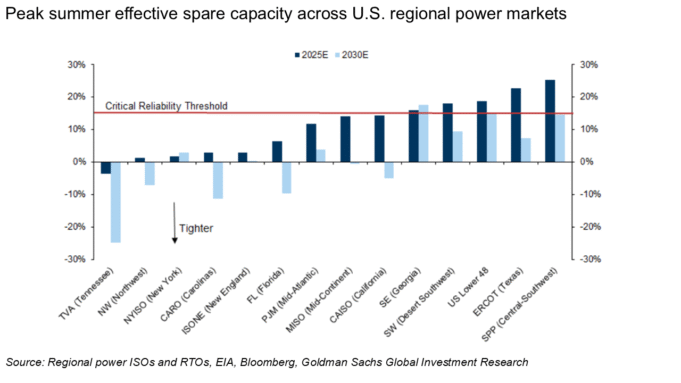
Electricity peak demand in the U.S. set new records twice in July (EIA), and demand is expected to continue at quite the clip. The administration canceling offshore wind projects, most notably the stop work notice to Revolution Wind, is the most recent example of energy policy designed to achieve political goals regardless of market fundamentals and the nationwide increasing demand for power. Nonetheless, as the need for affordable and reliable electricity intensifies, we expect the pressure to support a truly all-of-the-above energy mix will prevail. The scarcity value of power will take time to materialize, but it’s coming. Goldman Sachs found that all but one U.S. regional power market would reach critical tightness by 2030. At that point, the strain on the grid and the upward pressure on wholesale and retail energy prices will dictate policy decisions and not the other way around.
PPA prices, and wariness, up
PPA prices have increased 4% on average since the OBBB legislation was passed (LevelTen, Axios). Near-term modest increases are likely obscuring the true impact of the policy environment. Our expectation is that projects with commercial operation dates post ITC are trading much higher. More broadly, corporate buyers are eyeing the price uncertainty warily and despite a strong 1H, where corporates in the U.S. signed 12 GW of corporate PPAs, we wouldn’t be surprised to see a dip over the coming months. Some of the larger buyers will continue to be resilient while some of the smaller buyers will search for alternatives.
Interconnection queues begin to see some relief
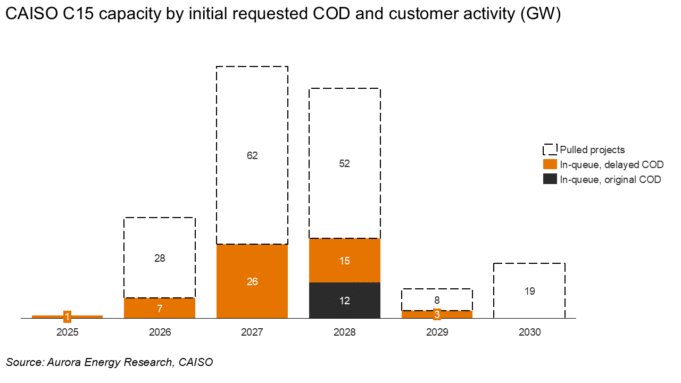
Interconnection queue costs and delays have been a key source of friction and frustration for clean energy developers in recent years. Some aspects of this are unlikely to change any time soon as David Riester lays out in a fun piece on The Game Theory of Grid Upgrades (link). But reforms years in the making are clearing out queues. Take CAISO as an example: to address clogged queues, FERC Order No. 2023 required transmission providers to move from a serial study process to a cluster study process. CAISO’s Cluster 15 is the first study process following this order, and the ISO’s Interconnection Process Enhancements (IPE). Over 168 GW and 75% of projects with original CODs between 2025 and 2030 exited C15 following FERC approved IPE Track II. Less than 30% of C15 projects remain post-IPE, showing the framework is effectively screening out non-viable projects.
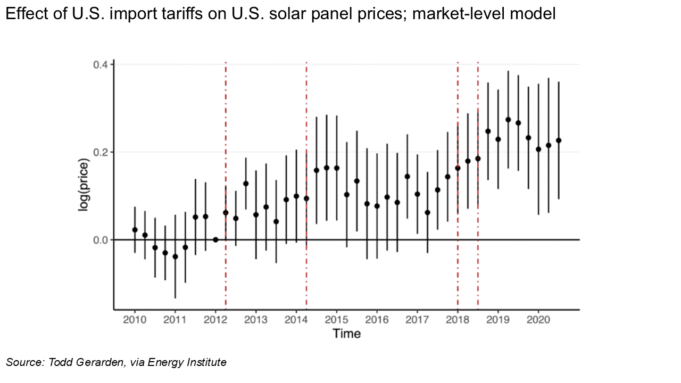
Tariffs push up prices, yield few benefits if not paired with demand-side certainty
A new telling of an old story. Academics studying previous rounds of U.S. tariffs on solar imports found that tariffs cost consumers more than they benefit domestic producers, undercut the domestic solar jobs market, and increase U.S. PV panel prices relative to other markets (Energy Institute).
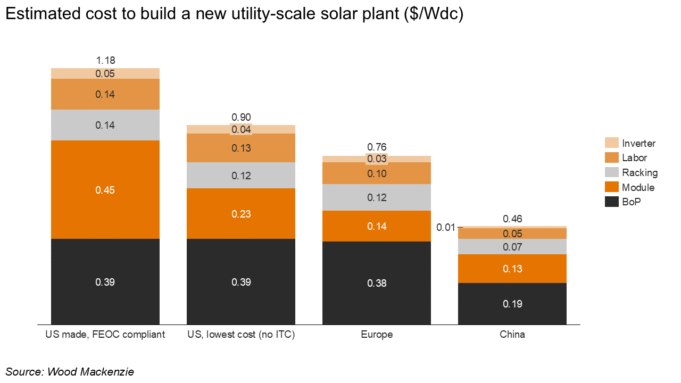
Building unsubsidized projects that do not need to be FEOC-compliant brings down the cost somewhat, but Wood Mackenzie data shows how tariffs push up the modules costs in the U.S. well above those in Europe.
Bargains, a bump, a slowdown, and green shoots for EV sales
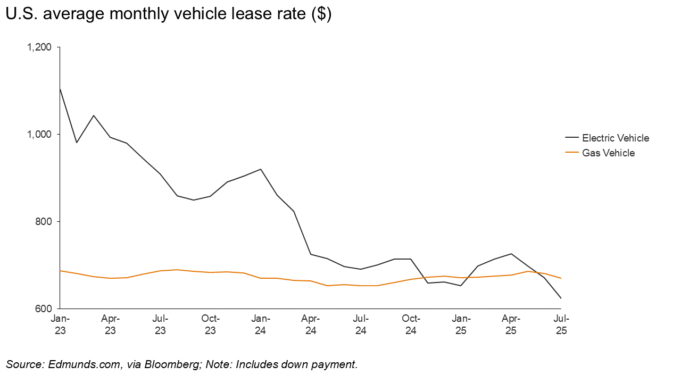
U.S. electric vehicle (EV) sales rose 26% month-over-month and 20% year-over-year in July, making it the second-highest month for new EV sales on record. EVs accounted for 9.1% of the overall market for new car sales. This push comes as consumers, automakers, and dealers rush to shift inventory and take advantage of federal EV tax credits before they expire on October 1. On average, incentives packages made up a record 17.5% of the average EV transaction price, a year-over-year increase of more than 40% per Cox Automotive (link, link). Leases make up nearly 75% of EV transactions, and July’s average EV lease rate was 7% cheaper than that of gas-powered car leases (Bloomberg).
While industry analysts expect EV sales figures to taper after the federal incentives expire this fall, there’s cause for continued market optimism in the form of new EV models and more charging infrastructure. Ford announced it will deliver a $30,000 all-electric truck in 2027 and rework its designs and processes to streamline EV production and lower costs (Heatmap 🔒). Meanwhile, the U.S. EV charging network continues to expand to provide the necessary infrastructure for sustained demand. Wood Mackenzie forecasts public fast chargers will maintain a 14% compound annual growth rate through 2040 (Wood Mackenzie). The EV chargepoint operator EVgo expects fast charger installations to grow by a factor of 2.7 from 2024 to 2030, compared to a 4.2x growth rate for EVs (link).
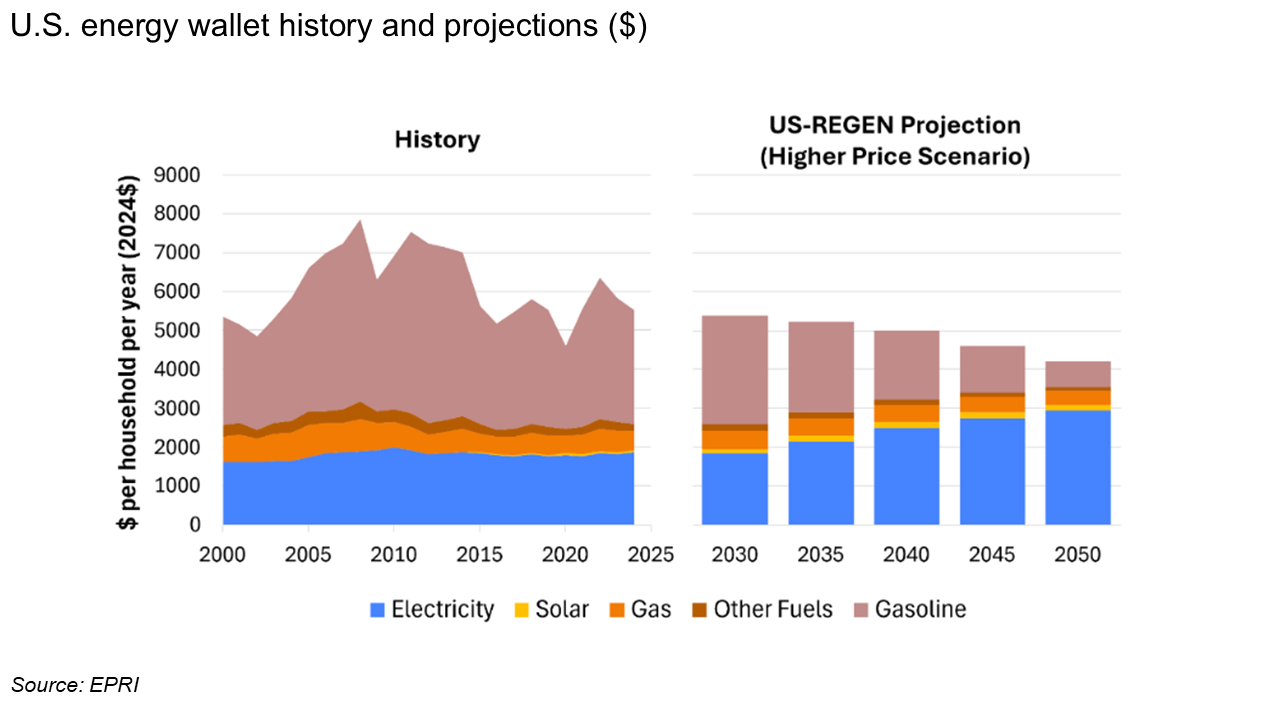
Decarbonization remains clear pathway to lower power costs
Even as electricity becomes more expensive, it’s still much more affordable and efficient than other power sources like gasoline and natural gas. Average U.S. household energy expenditures are projected to decrease 36% by 2050 as electricity increasingly replaces these fuels for transportation and home heating and takes on a greater share of consumers’ energy expenses (EPRI).
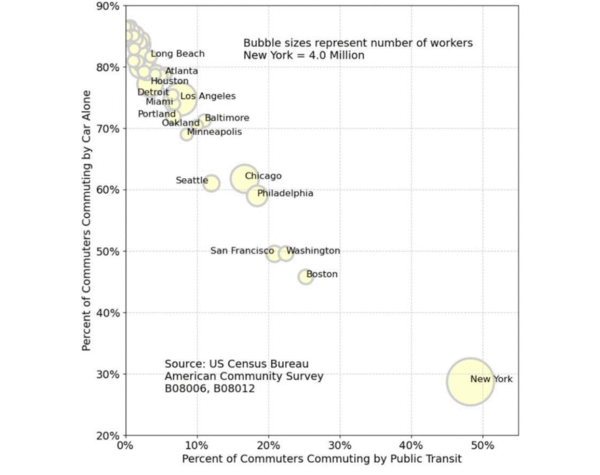
New York, the only real American city
Only tangentially related to the core themes of this newsletter, but this chart stood out so much I couldn’t resist including it (Noahpinion). No other U.S. cities come close to matching New York’s transit use or housing density. Closing that gap would require big changes to most cities’ building and transit policies.
Policy Notes
Federal
The U.S. Treasury released updated guidance that defines the “start of construction” requirements for solar and wind projects to lock in federal tax credits before they begin to phase out next July. The guidance eliminates the previous option for these projects to establish start of construction through 5% safe harbor. Starting September 2, they can solely qualify by demonstrating “physical work of a significant nature.” Projects that meet this definition will have four years to be placed in service, in line with existing practice (Utility Dive, Novogradac). Eliminating the 5% safe harbor for solar and wind projects will undoubtedly result in some projects not being developed, and will increase direct and indirect costs to many projects that do get built. However, the guidance was ultimately less painful than many in the industry had feared, and provides sufficient clarity for developers to be able to move forward with projects. The industry is now waiting for additional clarity surrounding Foreign Entity of Concern (FEOC) requirements.
The Department of Transportation released revised requirements for states to access federal EV charging funding through the $5 billion National Electric Vehicle Infrastructure program, following previous efforts from the Trump administration to freeze the program. The updated guidance pares back program requirements, including removing stipulations that a portion of the charging infrastructure reaches lower-income communities (Canary Media).
The Trump administration extended the life of a Michigan coal plant for the second time after it was scheduled to retire this month. Keeping the plant online will result in daily operating costs of $1 million (The Guardian, PoliticoPro 🔒, Utility Dive).
At the same time, the administration moved to cancel $7 billion in Solar for All grants (PoliticoPro 🔒), launched a national security investigation into wind turbine imports (E&E News 🔒), and shared plans to heighten scrutiny over solar and wind projects located on farmland (Reuters).
State and local
California officials shared strategies to increase EV adoption and limit tailpipe emissions after the Trump administration’s latest move to block the state’s enforcement of its emissions standards for trucks (LA Times, Axios, The Hill). They include new rounds of state-sponsored subsidies for EV purchases and charging costs and preserving single EV drivers’ ability to use less-congested carpool lanes.
Nineteen states sued the U.S. Department of Energy following the agency’s move to cap the “indirect costs,” such as buildings and personnel, that states can use its grant funding for at 10% (E&E News 🔒).
What we're reading
Oaktree commentary on the U.S. credit market. Still special? (link)
Energy leadership in a time of need: A blueprint for states (link)
The infrastructure investor still bullish on renewables (link)
How electricity got so expensive (link)
California lawmakers have a radical idea for lowering electricity bills (link)
Veloz EV market report (link)
Myths and lessons from a century of American automaking, h/t Construction Physics (link)
Sightline Climate’s report on data center development (link)
The puzzle of low data center utilization rates (link)
McKinsey report on data center demand (link)
America’s fourth reinvention (link)
More newsletters
January 2026 Newsletter
The U.S. power grid is currently a study in constructive interference, a phenomenon where separate waves meet, their peaks align, and they merge into a single, amplified force. Capacity and generation shortages, the elevation of affordability to the center of politics, community opposition, and concerns about emissions and reliability are powerful dynamics individually. Together they may force long-lasting changes to the U.S. power systems, as proposed wholesale changes across PJM this month illustrate.
Read moreDecember 2025 Newsletter
How 2025 sets the stage for 2026. A review of AI, interconnection reforms, clean power and large load growth.
Read more