By the numbers
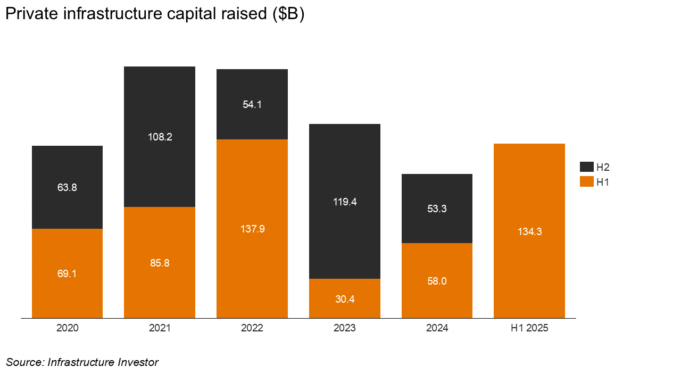
Infrastructure fundraising posts strong H1
Private investors raised $134.3 billion for infrastructure funds in the first six months of 2025, eclipsing the $111.3 billion raised throughout the entirety of 2024 (Infrastructure Investor). Data center- and renewables-focused funds accounted for 45% and 36% of the total capital raised, respectively. Load growth, especially for AI data centers, remains a clear and steady tailwind for the energy and infrastructure sectors. Solar, storage, and wind are the most effective technologies to meet this demand.
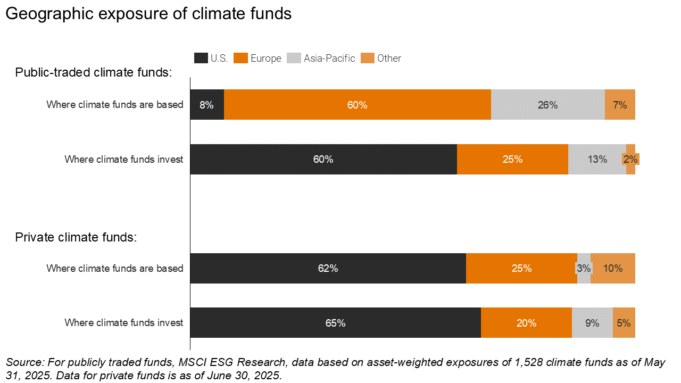
Climate funds invest most in the U.S.
Some 62% of privately held climate funds are based in the U.S., compared to only 8% of publicly traded ones. Publicly traded funds are concentrated in Europe. Regardless of where they are based, climate funds predominantly invest in the U.S. according to a data-packed quarterly report from MSCI.
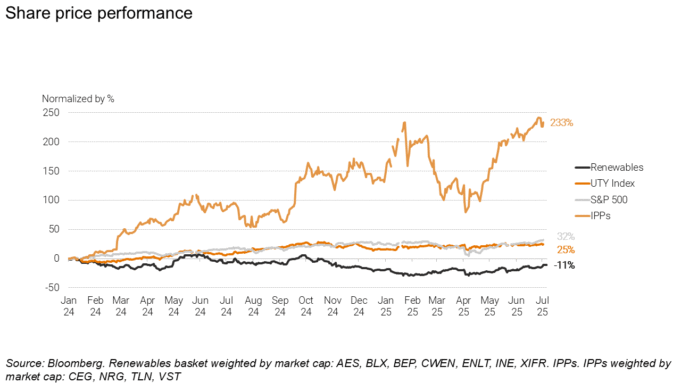
Renewables’ share prices lag behind IPPs’
Over the past 18 months, publicly listed renewable energy companies have lagged behind Independent Power Producers (IPPs) and regulated utilities, in part due to investor concerns around tariffs, evolving tax policy, and elevated interest rates. Recent developments however provide a higher degree of legislative and trade clarity, and the operating environment for renewables is now more stable than at any point this year. With demand set to outpace supply, operating assets and near-term development or construction projects are now more valuable than ever.
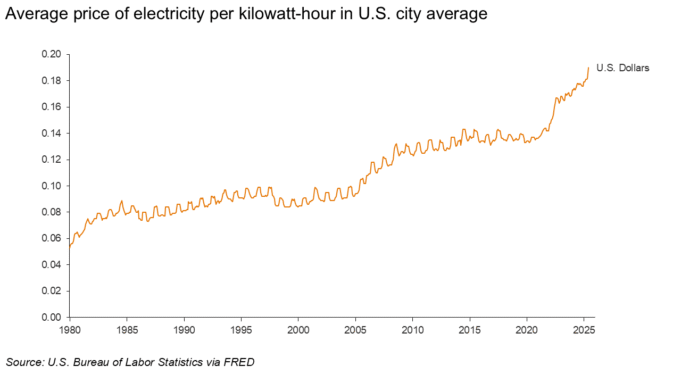
U.S. power prices are on the rise
U.S. electricity prices have mapped closely to inflation for much of the last few decades, but now electricity price increases are far outpacing overall inflation (link). The electricity component of the Consumer Price Index was up 5.8% year-over-year in June. This was the third month in a row where electricity came in above the broad inflation rate and marked an acceleration in that trend, rising to more than double the CPI’s 2.7% (Bloomberg).
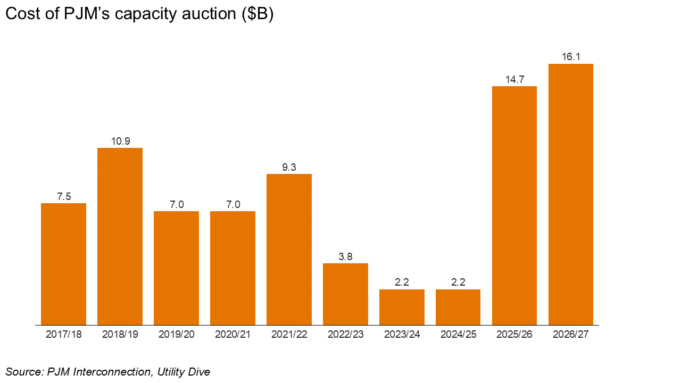
Power prices are rising as growing demand meets constrained supply. PJM’s 2026/2027 capacity auction hit the $329/MW-day cap, 22% above last year’s record, and would have risen an additional 18% without the cap (PJM). The total cost of the auction increased to $16.1 billion. This cost falls on consumers, and PJM expects the new capacity price to translate to 1.5% to 5% higher power bills (Utility Dive, Latitude Media). Expect this dynamic to be repeated, in PJM and elsewhere.
The OBBB will make power even more expensive by pushing up the cost of building generation assets while constraining the supply of renewable energy projects. Recent reports forecast the legislation will increase household energy costs substantially, with estimates ranging from $78 to $284 annually by 2035 (Rhodium Group, Energy Innovation, Evolved Energy Research).
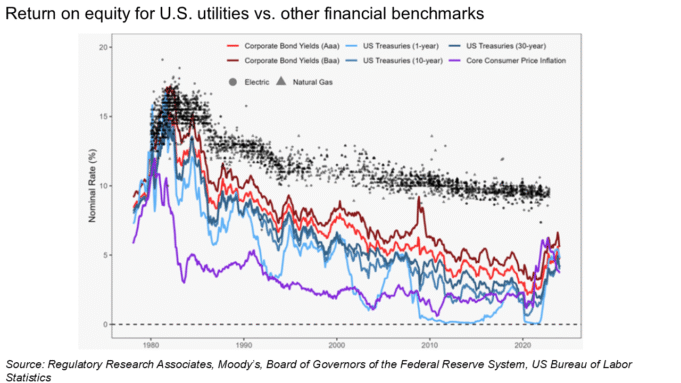
Sticking with the theme of higher bills, utilities across the U.S. asked for or secured $29 billion in rate increases so far this year, more than double their requested increases from the same period last year. This year’s utility rate hikes will affect 40 million U.S. consumers, according to analysis from PowerLines (Latitude Media). Consumer advocates also argue that regulators should take another look at the rate of return for utilities, citing an increasing disconnect between utilities’ ROR and other financial benchmarks (link, link).
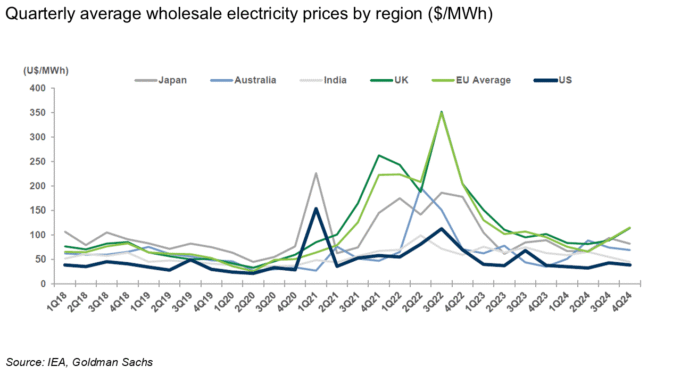
With all that said, power prices in the U.S. are still cheap relative to many other countries. Meeting load growth while maintaining these low prices requires more intentional planning such as implementing new rate designs and adding flexible connections. Thankfully, efforts on these fronts are accelerating. Arushi Sharma Frank wrote an excellent piece on a new program in SPP as an example: “SPP is giving large loads a way to plug in quickly via a bridge arrangement: the customer brings (or funds) a generator to support its load, accepts that its service can be curtailed if the grid is stressed (until upgrades catch up), and agrees to pay all initial upgrade costs – and in return, SPP lets them in the door years faster than the normal process would allow.” We also have more visibility than ever on tariffs designed to help plan for load growth, such as datasets from SEPA and Halcyon.
Record-breaking clean energy on U.S. grids
Even amid the hardship of the last few months, clean energy is still breaking records. Nine different days throughout July topped ERCOT’s solar generation list, most recently on July 29 (29,318 MW). July 29 also set the ERCOT record for power storage (6,718 MW). And three more battery storage projects from esVolta, providing 1 GWh of energy, are now online in Texas (link). The CAISO region saw its maximum solar record set four times this month, most recently on July 30 with 21,745 MW (GridStatus).
August tariffs create noise, but the picture is clearer
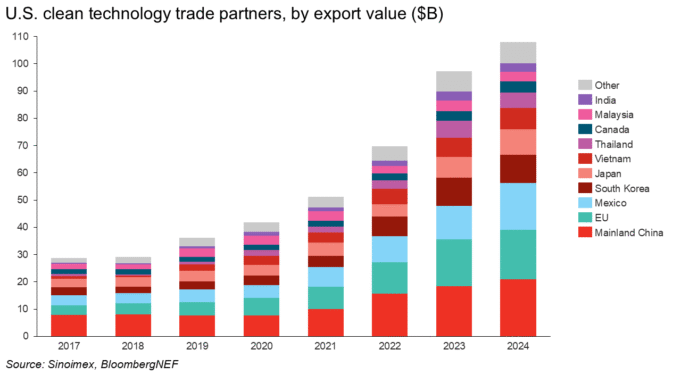
Five trade partners account for about two-thirds of U.S. imports: the EU, Canada, Mexico, China, and Japan (Richard Baldwin).
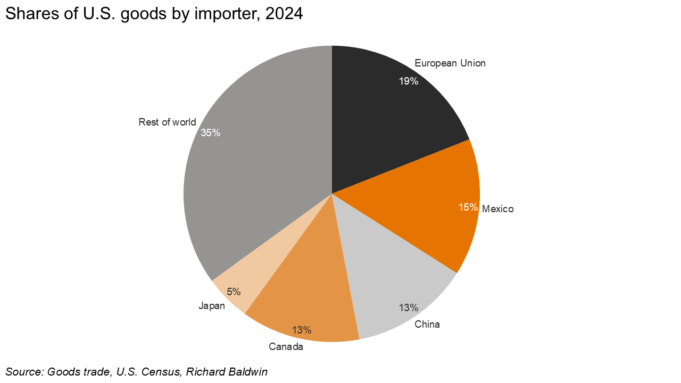
In addition to these five, South Korea, Vietnam, Thailand, Malaysia, and India make up the top 10 for clean energy imports specifically.
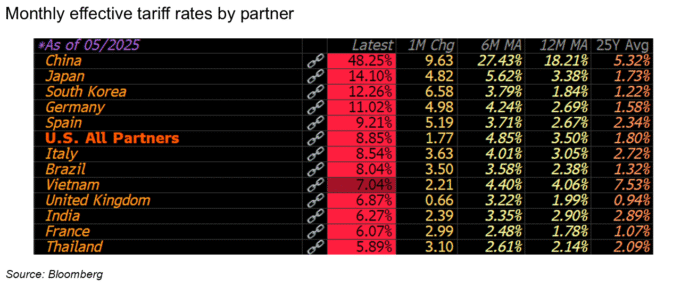
After months of tariff volatility, we now have increasing clarity around tariffs as agreements materialize between the U.S. and many of these key trading partners. Though much less detailed than traditional tariff agreements, these new agreements give us an indication of where the U.S.’s tariff regime is headed. The U.S. announced tariff agreements of 20% on imports from Vietnam, and 15% on imports from Japan, the EU and South Korea, in quick succession. This range is becoming the standard (NPR). U.S. and Chinese officials also agreed to seek an extension of their 90-day tariff truce, although a final agreement is still forthcoming.
To be clear, uncertainty remains and the effective tariff rate on U.S. trading partners will be materially higher in this new trading environment than in recent years. There are also several product-specific tariffs to keep an eye on that risk pushing up costs. Nonetheless, we are entering a period of more stability and process, and the clean energy industry has proven its resilience time and time again.
Policy Notes
A hostile federal regulatory environment
The EPA proposed a rule that would revoke the 2009 “endangerment finding,” which provides the foundation for many of the federal government’s emissions regulations, including its rules for limiting emissions from vehicles and power plants (PoliticoPro). If successful, the repeal will almost certainly spark lawsuits and set off a long legal battle. Coinciding with the EPA’s new rule, the DOE published a report that disputes the extent of economic damage caused by CO2-induced warming (DOE).
A few days after the OBBB legislation was passed and we published our initial analysis of its implications, President Trump issued executive orders that complicate safe harbor rules (Latitude Media) and further restrict access to wind and solar tax credits (White House). The “foreign entities of concern” rules also remain complicated and restrictive (Norton Rose Fulbright). Even with these lingering uncertainties, the OBBB provides a clearer view on the path forward for the energy and infrastructure industries than we’ve seen in months, with incentives intact for a subset of energy transition technologies.
The administration loosened regulations on coal (AP, White House) while adding review layers to wind and solar projects (Politico). As of July 30, there were signs of congressional pushback here, with a handful of Senate Republicans escalating pressure on the Trump administration to back off its efforts to constrain new solar and wind energy projects (Politico).
State and local policies
California Governor Gavin Newsom signed two bills to help reform CEQA, the state’s environmental review and permitting law that increasingly creates unnecessary delays and adds costs (Construction Dive, Tom Steyer).
The New York Power Authority shared a revised draft of its strategic plan that calls for developing 6.8 GW of clean energy projects, more than double the capacity included in its previous draft (Times Union). New York also issued an RFP for 1 GW of energy storage for its Bulk Energy Storage Program as part of the state’s goal to deploy 6 GW of energy storage by 2030 (Utility Dive).
Maine set a new mandate to transition to 100% clean energy by 2040, a decade sooner than its previous decarbonization plans (Maine Monitor). The state’s utility regulators are now fast-tracking procurement plans for 1,600 GWh of renewable energy before federal tax credits expire (Canary Media).
What we're reading
Antifragile? Renewables after the One Big Beautiful Bill (link)
America’s clean energy transition will continue despite the OBBB (link)
Now that the IRA is nearly gone, do we know how much we will miss it? (link)
Implications of the OBBB for different states (link)
The long march of electrification (link)
DOE Report on Reliability (link). Is this the end of independent government research in the U.S. (for now)? (Canary Media)
Negative power prices in CAISO (link)
Every Electricity Demand Reduction is a Cost Shift (link)
Sightline Climate Report: H1 Climate Tech Investment Trends (link)
Net Zero Insights: State of Climate Tech H1 (link)
EEI 2024 Financial Review (link)
Pillars of Power (link)
More newsletters
March 2026 Newsletter
Just over four years after the "ChatGPT moment", February 2026 marked a new inflection point for how many of my peers and I use AI. The constraints switched from model limitations (both perceived and real) and perhaps a lack of creativity and prioritization, to token and inference constraints: "Rate Limit Exceeded", "A bit longer, thanks for your patience." Powering a data center now requires simultaneous execution across three domains that each demand deep, specialized expertise: the grid and interconnection, on-site generation, and policy and regulation. And while AI has come in strides, the limits to scaling compute quickly are intransigent. They are physical, geographic, and increasingly personal.
Read moreFebruary 2026 Newsletter
Just over four years after the "ChatGPT moment", February 2026 marked a new inflection point for how many of my peers and I use AI. The constraints switched from model limitations (both perceived and real) and perhaps a lack of creativity and prioritization, to token and inference constraints: "Rate Limit Exceeded", "A bit longer, thanks for your patience." Powering a data center now requires simultaneous execution across three domains that each demand deep, specialized expertise: the grid and interconnection, on-site generation, and policy and regulation. And while AI has come in strides, the limits to scaling compute quickly are intransigent. They are physical, geographic, and increasingly personal.
Read moreJanuary 2026 Newsletter
The U.S. power grid is currently a study in constructive interference, a phenomenon where separate waves meet, their peaks align, and they merge into a single, amplified force. Capacity and generation shortages, the elevation of affordability to the center of politics, community opposition, and concerns about emissions and reliability are powerful dynamics individually. Together they may force long-lasting changes to the U.S. power systems, as proposed wholesale changes across PJM this month illustrate.
Read more